This web page was produced as an assignment for Genetics 564 at UW-Madison in Spring 2014.
What is Protein Phylogeny?
Protein phylogeny allows for the examination of changes in species over time based on their protein sequences. Phylogenetic tree programs are used to construct diagrams that represent relative similarity relationships between different species.
Clustal Omega
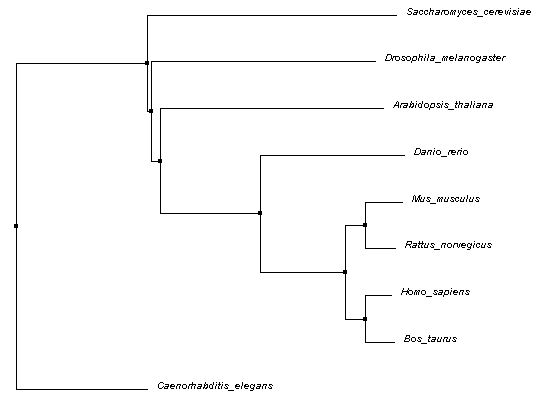
The following Average Distance phylogenetic tree was generated using Percent Identity (PID) method and Clustal Omega alignments. Average Distance trees are generated by putting closely related sequences at the same node with branch lengths representing estimated differences [1]. PID is calculated using the following formula:
# of equivalent aligned amino acids * 100/ smallest # of non-gaps in either sequence
This gives essentially a number of matches per 100 amino acids. In contrast, BLOSUM62 calculations simply score for amino acid equivalency at each position aligned [2]. These trees are not shown, but can be downloaded here (Average Distance).
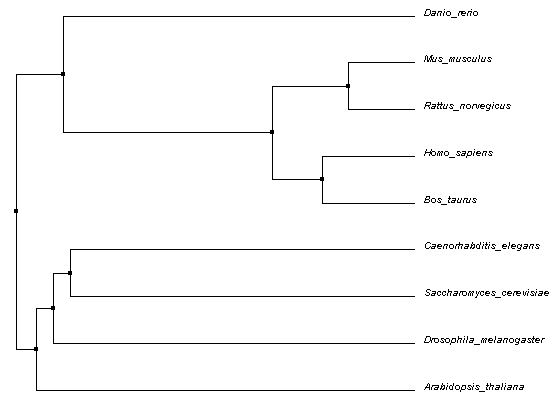
Figure 1: Phylogenetic tree of Average Distance using Percent Identity method
The Neighbor Joining tree shown below was also calculated using PID and Clustal Omega alignments. A Neighbor Joining tree differs from an Average Distance tree in that is will generate a tree with the shortest branches possible. Again, the BLOSUM62 tree is not shown, but can be downloaded here (Neighbor Joining).
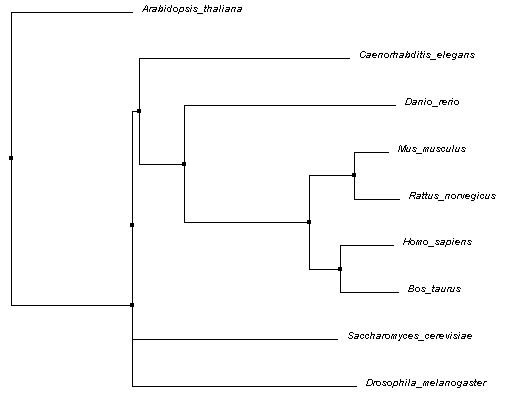
Figure 2: Phylogenetic tree of Neighbor Joining using Percent Identity method
PhyML
The tree displayed below was constructed using PhyML and MUSCLE alignment. PhyML is unique in that it allows the user to interact with the generated tree by flipping branches and changing roots. It also uses bootstrapping to assess estimate accuracy [3, 4].
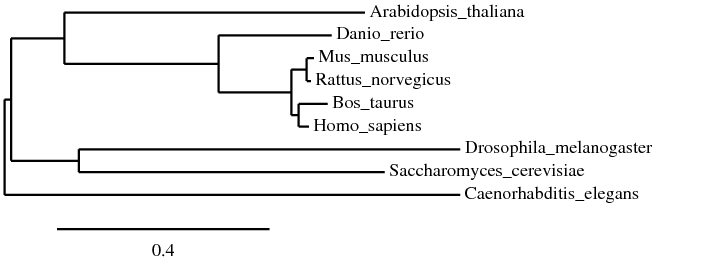
Figure 3: Phylogenetic tree constructed with PhyML and MUSCLE alignment
Discussion
All three trees shown appear to have some core similarities in structure. The mammals (mouse, rat, cow, human) are grouped in the same node, with cow and human sharing a node and mouse and rat sharing another node. This is expected, since they all belong to the same class (Mammalia). Zebrafish shares a node with all four mammals as well. All five being from the subphylum Vertebrata of the phylum Chordata, this is also expected. However, the placement of the remaining organisms differed across each tree. Flies, roundworms, yeast, and thale cress are all further removed, though, and this makes sense considering the differences in phyla.
[1] Delsuc F, Brinkmann H, Philippe H, Phylogenomics and the reconstruction of the tree of life, Nat Rev. 6 (2005) 361-375. PMID: 15861208
[2] JalView. Web. 17 Feb. 2014. <http://www.jalview.org/help/html/calculations/tree.html>.
[3] Rhodes, Gale. "Bioinformatics Tutorial." DeepView - Swiss-PdbViewer. ExPASy, 2008 Web. 17 Feb. 2014. <http://spdbv.vital-it.ch/TheMolecularLevel/Matics/improve.html>.
[4] Efron B, Halloran E, Holmes S, Bootstrap confidence levels for phylogenetic trees, PNAS 93 (1996) 13429-13434. PMID: 8917608
