This web page was produced as an assignment for Genetics 564 at UW-Madison in Spring 2014.
What is a microarray?
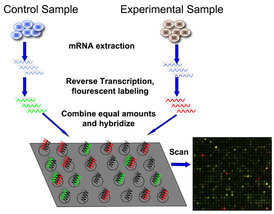 Microarray workflow.
A microarray allows for the study of many different genes at the same time. Platforms used contain large groupings of short DNA sequences, and the locations of these clusters on the platform is already specified. These platforms are often used to study the levels of gene expression. Preparation involves obtaining mRNA from an organism of interest with a specific genotype, and generating more stable cDNA from it. Then, this cDNA is placed on the microarray and allowed to hybridize, or match up, with the short DNA sequences on the platform. Different clusters on the platform will emit certain colors based on how much hybridization occurs at each spot [1]. Scientists can then compare the expression levels of particular genes across different scenarios, such as different genotypes. This data gives insight into the state of the cells in a particular condition or with a different genotype.
Microarray Data for PEX1
NCBI's GEO database stores a variety of microarray data submitted by researchers internationally. By searching a condition or gene of interest, one can obtain relevant expression profiles from this database. A search for PEX1 microarray data in humans yields plenty of inconclusive microarray data that does not hold significant relevance to ZSS.
So, I proceeded to search through GEO Series using GEO2R to compare wild type to homozygous PEX1 mutants. I found data from a study comparing retinas of M. musculus and data from another study comparing D. melanogaster larvae.
So, I proceeded to search through GEO Series using GEO2R to compare wild type to homozygous PEX1 mutants. I found data from a study comparing retinas of M. musculus and data from another study comparing D. melanogaster larvae.
 (Fig 11 from Mast, et al. 2011, click to enlarge).
The data from D. melanogaster larvae compared three replicates of wild type to three replicates of PEX1 homozygous mutant larvae. Using GEOR2, one can obtain expression data of all genes tested on the particular platform [GEO Accession: GSE30362]. This analysis identified 551 genes with significant differential expression involved in processes like meiosis, gamete genesis, metabolism, neuronal development, and innate immunity were affected in larvae with defective PEX1 (see figure to left) [2].
The data from M. musculus retinas compared four replicates of PEX1-G844D/wild type to four replicates of PEX1-G844D/PEX1-G844D. Again, the expression data of all genes on this particular platform were obtained [GEO Accession: GSE52348]. The evidence in the PEX1 deficient mouse model for retinal degeneration made this a good model tissue for microarray analysis. The authors identified six differentially expressed genes that may affect this degeneration: Arr3, Pde6h, Gnat2, Opn1mw, which had lower expression, and Cyp4a14 and Ufd1l, which had increased expression [3]. The expression graphs of these six genes are displayed below, along with lists of their gene ontology terms.
The data from M. musculus retinas compared four replicates of PEX1-G844D/wild type to four replicates of PEX1-G844D/PEX1-G844D. Again, the expression data of all genes on this particular platform were obtained [GEO Accession: GSE52348]. The evidence in the PEX1 deficient mouse model for retinal degeneration made this a good model tissue for microarray analysis. The authors identified six differentially expressed genes that may affect this degeneration: Arr3, Pde6h, Gnat2, Opn1mw, which had lower expression, and Cyp4a14 and Ufd1l, which had increased expression [3]. The expression graphs of these six genes are displayed below, along with lists of their gene ontology terms.
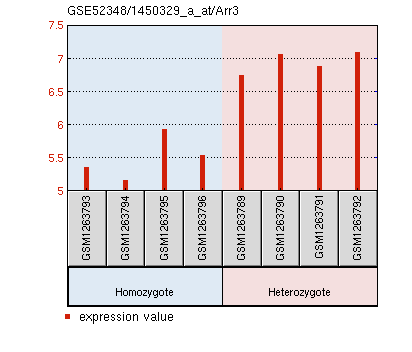
Arr3 expression is significantly reduced in PEX1 homozygous mouse retinas.
Molecular Function: opsin binding, phosphoprotein binding, protein domain specific binding Biological Process: endocytosis, regulation of protein phosphorylation, response to stimulus, signal transduction, visual perception Cellular Component: photoreceptor outer segment, synapse 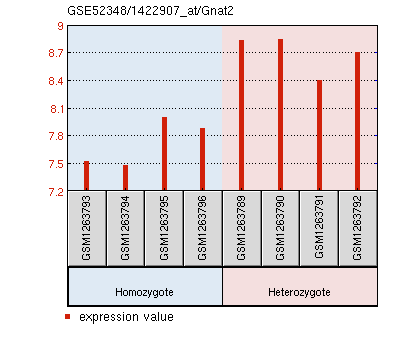
Gnat2 expression is significantly reduced in PEX1 homozygous mouse retinas.
Molecular Function: G-protein beta/gamma subunit complex binding, G-protein coupled receptor binding, GTP binding, GTPase activity, guanyl nucleotide binding, metal ion binding, nucleotide binding, signal transducer activity Biological Process: G-protein coupled receptor signaling pathway coupled to cGMP nucleotide second messenger, GTP catabolic process, adenylate cyclase modulating G-protein coupled receptor signaling pathway, detection of chemical stimulus involved in sensory perception of bitter taste, detection of light stimulus involved in visual perception, phototransduction, response to stimulus, retinal cone cell development, rhodopsin mediated signaling pathway, signal transduction, visual perception Cellular Component: extrinsic to internal side of plasma membrane, heterotrimeric G-protein complex, membrane, photoreceptor inner segment, photoreceptor outer segment 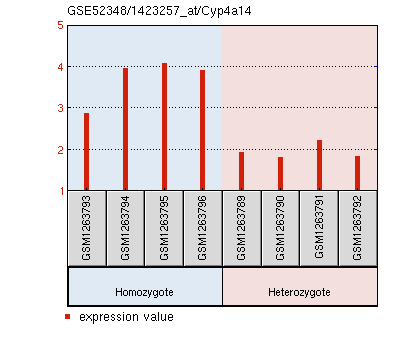
Cyp4a14 expression is significantly increased in PEX1 homozygous mouse retinas.
Molecular Function: alkane 1-monooxygenase activity, arachidonic acid binding, arachidonic acid monooxygenase activity, arachidonic acid omega-hydroxylase activity, electron carrier activity, fatty acid binding, heme binding, iron ion binding, metal ion binding, monooxygenase activity, oxidoreductase activity Biological Process: oxidation-reduction process Cellular Component: endoplasmic reticulum, intracellular membrane bounded organelle, membrane |
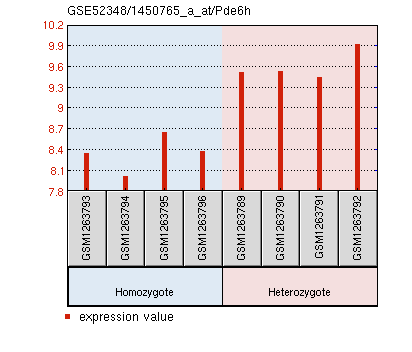
Pde6h expression is significantly reduced in PEX1 homozygous mouse retinas.
Molecular Function: 3',5'-cyclic-GMP phosphodiesterase activity, 3',5'-cyclic-nucleotide phosphodiesterase activity, cGMP binding, hydrolase activity Biological Process: activation of MAPK activity, positive regulation of G-protein coupled receptor protein signaling pathway, positive regulation of epidermal growth factor receptor signaling pathway, response to stimulus, visual perception Cellular Component: none 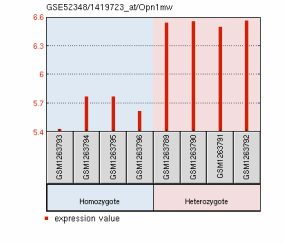
Opn1mw expression is significantly reduced in PEX1 homozygous mouse retinas.
Molecular Function: G-protein coupled receptor activity, photoreceptor activity, signal transducer activity Biological Process: G-protein coupled receptor signaling pathway, phototransduction, chromophore linkage, response to stimulus, signal transduction, visual perception Cellular Component: integral to membrane, membrane, photoreceptor outer segment 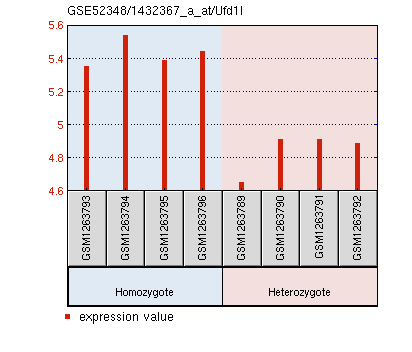
Ufd1l expression is significantly increased in PEX1 homozygous mouse retinas.
Molecular Function: protein complex binding, receptor binding Biological Process: ubiquitin-dependent protein catabolic process Cellular Component: cytoplasm, nucleus |
Discussion
The lack of solid microarray findings available for PEX1 and peroxisome biogenesis disorders in humans is most likely reflective of the rarity of these diseases. Future study on transcriptome changes in models and/or patients with defects in peroxisome biogenesis will help to elucidate these processes and how to fix the problems present in ZSS patients.
The information obtained from microarray analysis of PEX1 deficient D. melanogaster has given some insight as to what processes besides peroxisome biogenesis are defective in this model. Further study will improve our understanding of how peroxisomes are involved in processes such as neuronal development.
The information from the microarray analysis of PEX1 deficient M. musculus retinas has identified genes potentially responsible for retinal degeneration in this model. Further microarray study of other tissues may identify genes responsible for other symptoms seen in patients with ZSS, such as defective neuronal development. This is essential for our overall understanding of the disease manifestation.
[1] "Genotyping & Microarray." Coriell Institute for Medical Research. 2014. Web. 12 May. 2014. <https://www.coriell.org/research-services/genotyping-microarray/overview>
[2] Mast FD, Li J, Virk MK, Hughes SC et al. A Drosophila model for the Zellweger spectrum of peroxisome biogenesis disorders. Dis Model Mech2011 Sep;4(5):659-72. PMID: 21669930
[3] Hiebler S, Masuda T, Hacia JG, Moser AB et al. The Pex1-G844D mouse: A model for mild human Zellweger spectrum disorder. Mol Genet Metab 2014 Apr;111(4):522-32. PMID: 24503136
Image References
Microarray workflow: http://bitesizebio.com/7206/introduction-to-dna-microarrays/
PEX1 heatmap: http://dmm.biologists.org/content/4/5/659/F11.large.jpg
PEX1 expression profiles obtained from: GEO database
